Although 2020 has not gotten off to a great start, let’s be honest—we’re all looking forward to 2021. We thought now would be a good time to reflect on the past year and see what worked and what didn’t work when it came to paid social advertising, something we can all attest to spending a multitude of our time on in the past month or so.
Taking a look back at a much more stable year, 2019, we were able to pull benchmark data that allowed us to analyze both platform and quarterly trends along with a few recommendations for clients and advertisers.
Platform performance
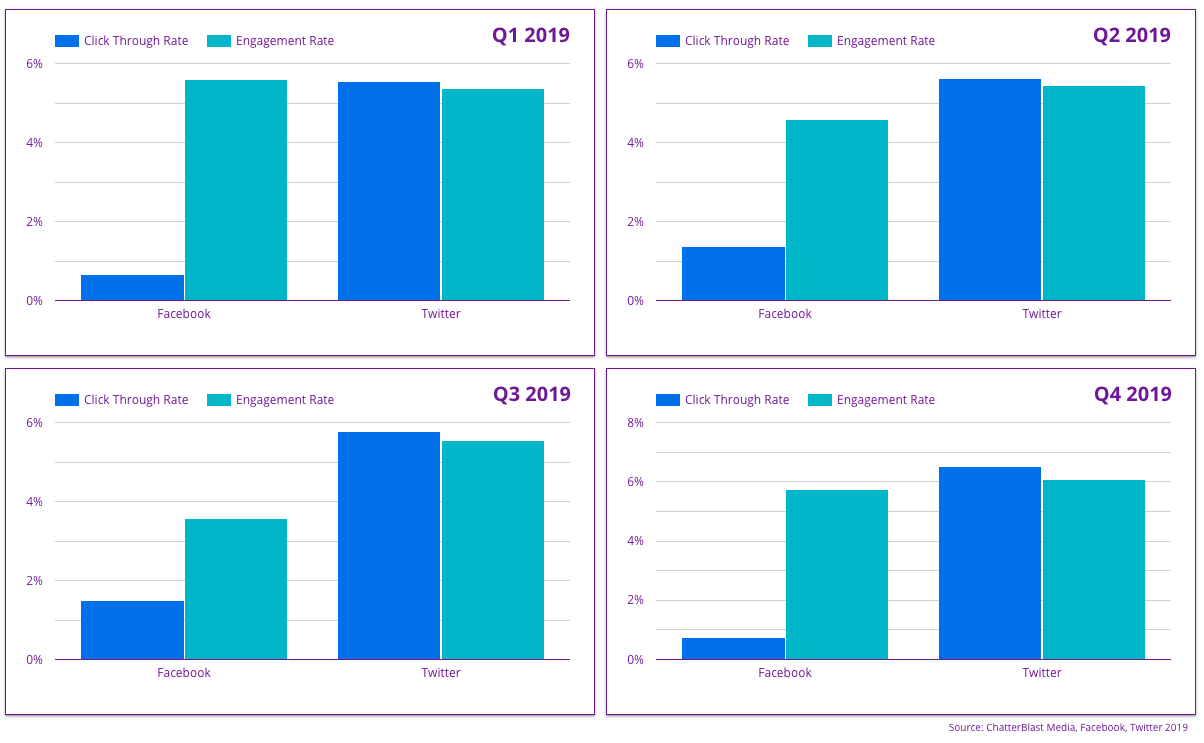
Out of the big three (Facebook, Instagram, and Twitter), you may be surprised to find that from our data, Twitter had the highest click-through rate and the highest engagement rate, making it a smart platform for advertising. Not all clients advertise on Twitter, probably due to the big names that Facebook and Instagram hold and the fact that they have more active users, but the data shows that users interact more with ads on Twitter, making it an underdog out of the big three social media platforms.

Photo via Unsplash
Recommendation
Consider advertising on Twitter. Although it doesn’t have as big of a name as Facebook/Instagram and has less active users, click-through rates and engagements are high. According to our data, more people engaged with ads on Twitter than any other platform.
Facebook and Instagram optimization
For the other two social platforms, we found the combination of Facebook and Instagram made the most sense, optimizing the results overall. When Facebook and Instagram were advertised separately, the results weren’t as strong, most notably on Instagram, where its click-through rate was much lower on average.
Also, Facebook’s engagement rate was lower than standard on its own. We found that when these two were combined, however, all of these numbers improved, most notably click-through rate, cost per thousand, cost per click, and the engagement rate.
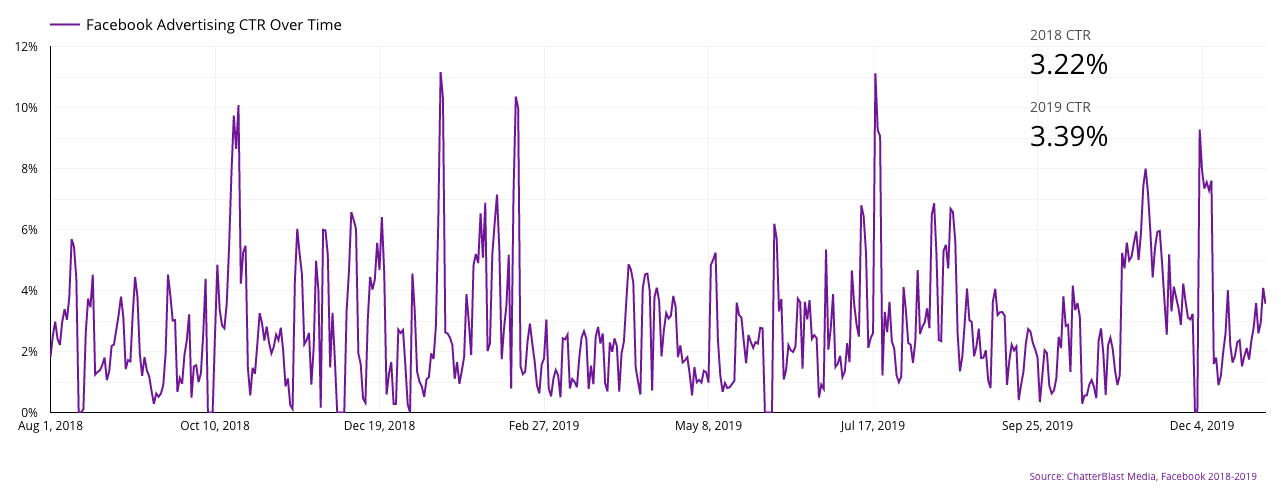
This client started optimizing across placements on Facebook at the beginning of 2019 and saw a 5.28% jump in performance year over year!
Recommendation
Optimizing Facebook and Instagram for paid social ads makes the most sense and saves you time and money. We recommend combining the two for better results overall.
Quarter performance
After analysis of the average KPIs found in each quarter among all social platforms, we found interesting data about quarters Q1 and Q4. This may be expected, due to Q4 being one of the most popular times to advertise due to the busy holiday season and end-of-year festivities.
Something we noticed right away about the data pulled from Q1 was that costs were low and that the most impressions overall were garnered in this period. On the other hand, we noticed that in Q4, the costs were at their highest, but that overall KPIs were strong, including the highest engagement rate and the highest number of engagements out of all of the quarters.
Based on this, we figured both would be great quarters to advertise in, but which would truly be the best? On one hand, Q1 is great for costs, with good result averages and a large number of impressions.
On the other hand, Q4 had high costs, but was the best for engagements by far, while also having good result averages. Ultimately, it comes down to the individual business and what they are willing to put in to see results. For a business that doesn’t have a big paid social budget or is just starting to advertise on this platform and needs to test the grounds first, Q1 would be a great option due to its low costs and high results.
However, for pretty much anyone else, Q4 seems to be the winner. Although there may be competition and higher costs, the data shows that people are interacting and engaging with ads the most during this quarter, and for overall KPIs, this quarter does yield the best results overall.
Recommendation
Q1 is the best bang for your buck with low costs and high impressions, but overall people are engaging and interacting the most with ads in Q4, making both of these quarters essential for advertising.
***
Benchmarks are helpful because they create a standard from which to aim and compare campaign results. Just from looking at the numbers of the prior year, we were able to tell a story to better understand the best times to advertise throughout the year and how specific actions impacted overall results.
Although we are living in a time of uncertainty and our sense of normalcy is shaken, data is a reliable indicator that can help us form narratives about consumer behavior and what worked and what didn’t. It will be interesting this time next year to analyze the behaviors of consumers during a global pandemic, and how paid social fared during this time. For now, we can only make predictions and continue to analyze the current data.