
With modern advances in technology and data science, businesses no longer rely on the eye test to measure success. Business intelligence (BI) has emerged as a critical resource across all industries to better understand victories and shortcomings using data. Understanding which metrics and factors play a role in this process is increasingly important.
A great example of the power of BI and data-driven business models is the strides advanced analytics have taken in professional baseball. The importance of business intelligence is captured in one of my favorite sports movies, Moneyball, based on the Oakland Athletics’ transition to analytics.
In the movie, General Manager Billy Beane (played by Brad Pitt) asks his scouting staff to identify the problems with the team after losing key players. Their responses focus on players’ physical attributes, off-field issues, and traditional counting stats like home runs, all based on the eye test.
However, Beane employs a different approach, leveraging data to make informed decisions about which players will deliver similar results for a fraction of the cost. Beane uncovers the devil in the details, leading to a new business model of finding undervalued players that other Major League teams can’t see with just the eye test. This changed the competitive landscape across the MLB and resulted in an analytics movement across the league. Beane was interviewed in 2011 about how identifying key metrics and data has made decision making a more efficient process.
So how does this long sports movie recap come full circle to your business? Well, it’s an important lesson that there is a distinction between perceived value based on the subjective things we think we see versus the power and insights that data can provide.
Moneyball illustrates the significant role data plays in evaluating business decisions to get a leg-up on competition and make financially sound decisions. A few areas BI can help businesses make informed decisions include:
- Sales trends and revenue
- Marketing effectiveness
- Optimization of processes and operations to save money
- Competitive analysis
- Content strategy
- Website conversions
How does this relate to digital strategy?
Say you notice that your brand’s blog content on Facebook is generating a ton of engagement (likes, comments, etc). On the surface, that appears to be positive, but how do these interactions translate to clicks, page views, time on page, and additional events on your website? This is where BI plays a role in recognizing what content types drive the desired results and where course corrections may be necessary.
At ChatterBlast, we continue to expand our BI efforts to provide solutions and services for our clients to optimize the way they do business on social and digital media. We’ll guide you through the process of assessing content and advertising strategies and use the data to justify those actions. Below are a few tactics we use for BI to assist our clients.
Audit and strategy
“You can’t find out where you’re going if you don’t know where you’ve been.” This phrase is crucial for understanding your audience, your content, and the types of interactions happening between them. Where are the primary sales markets? What is the correlation between social media activity and sales? How should advertising spend be allocated? These are common questions we can assist with in the audit phase by researching the proper data points.
Benchmarking and KPIs
Benchmarks and key performance indicators (KPIs) are important elements for measuring success. We can provide the direction to reach your KPIs or advise on the metrics we recommend for your business. Learn more in our blog about the power of customizing benchmarks.
Customized dashboards
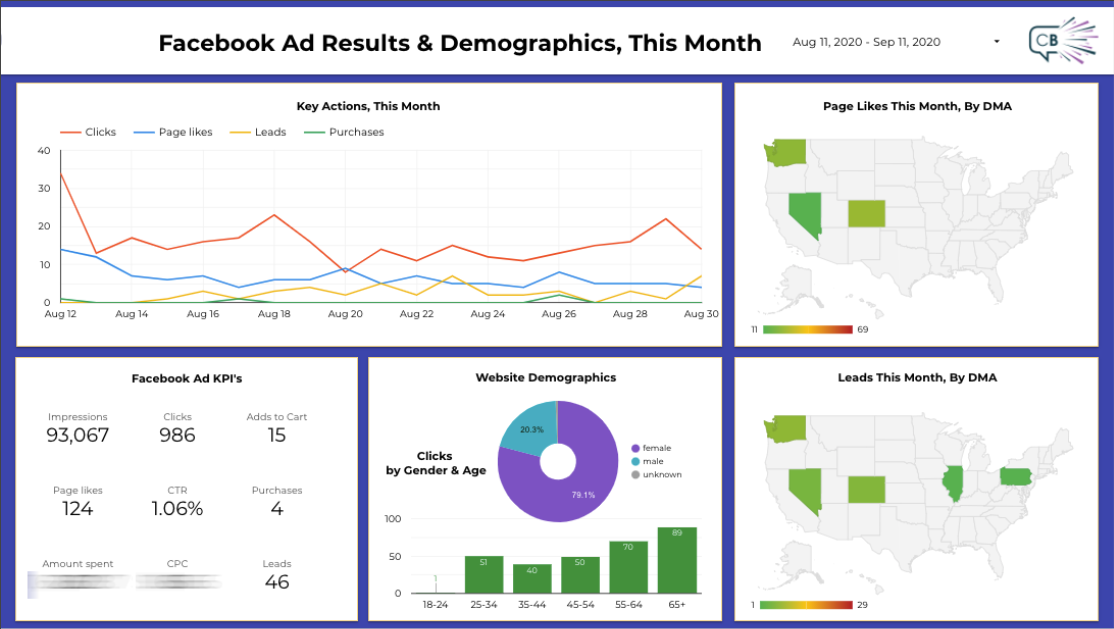
A sneak peek at a ChatterBlast custom reporting dashboard.
Sorting through reports and data can be a daunting and time-consuming task. Creating a customized dashboard saves time and money in the process of understanding social media and business performance by aggregating data into one interactive dashboard. ChatterBlast’s dashboards pull the data from social channels or data sets into charts and graphs that make it easier to identify trends and strategize pivots. There are plenty of reasons why dashboard reporting is more efficient and useful for businesses, which you can read about in this blog.
If you are looking for enhanced BI capabilities, reach out to us! We’ll find the solutions and services that make the most sense for your business.