Philadelphia: land of the cheesesteak, home of the liberty bell, and in 2020, the epicenter of a political battle unlike any other.
Sure, we’d love to talk about our hometown pride when it comes to Emmy-winning Abbott Elementary, or our hopes for a Phillies World Series… but when our basic human rights are at risk in the upcoming midterm elections, we want to set the record straight.
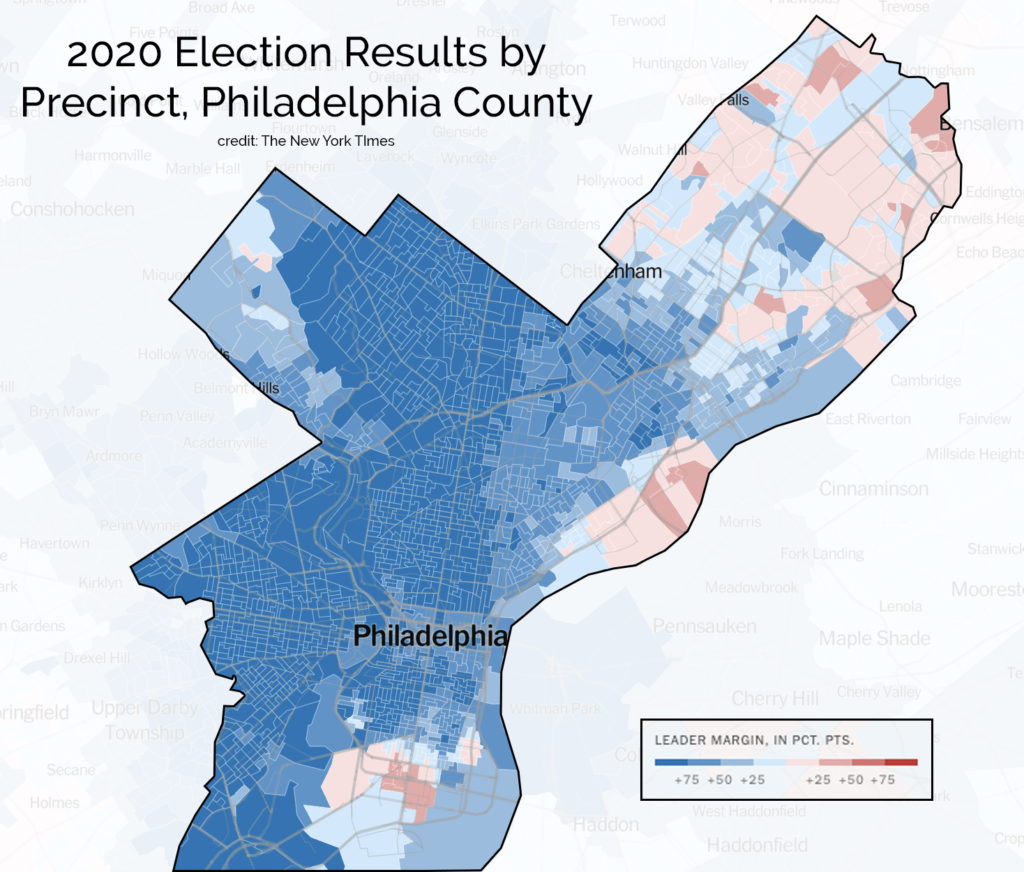
The general election fight between Donald Trump and Joe Biden came down to a few key areas in a few key states—Pennsylvania notably being one of them. Since ChatterBlast is based in Philadelphia, we (your friendly neighborhood Ads & Analytics team) decided to see where the dust has settled since. The following analysis looks at the entire Philadelphia County voter record (which is publicly available), not only to dispel some of the wealth of misinformation that was born out of the 2020 election, but also examine the impact social media can have on the election process and voter behaviors.
Looking Back at 2020: Ghosts of Elections Past
In the 2016 presidential election, Democratic candidate Hillary Clinton took the majority of Pennsylvania’s votes, coming in at 82.5%. The Republican candidate, Donald Trump, received 15.4%, leaving the rest to third-party candidates. Fast forward four years, and the Republican party showed greater support in Pennsylvania, as votes for Trump rose to 17.9%. Even so, based on this, we can predict that Philadelphia county will continue to lean far liberal in 2022’s upcoming election.
So while Republicans gained ground percentage-wise in 2020, it’s significant to note that social media played a large part in this surge, with the Republican party utilizing various platforms to spread false narratives in their favor. Trump infamously took to Twitter on multiple occasions, wrongly declaring his own victory or claiming thousands of mail-in ballots had been thrown in dumpsters (which turned out to be empty envelopes).
To try and combat rampant misinformation, platforms labeled posts letting users know it was misleading. However, some right-wing accounts made it hard for the media to dispel these narratives. Although the election results were clear, Trump’s campaign continued to fight (and some still do) to change the narrative and claim himself as the winning candidate. Media outlets paid the price and were challenged with moderating these false claims—although this likely didn’t do enough, as we all know what happened on January 6th…
Looking even closer at the voting data, we found that while there were about 24,000 more Republican voters in 2020 than there had been in 2016, almost 38,000 registered voters of any affiliation still sat out in Philadelphia alone. With this many registered non-voters, the motivation to vote was clearly lacking. We can see that the votes strictly came down to personal interest, as record rates have proven that mail-in ballots from 2020 didn’t lead to the increase in Democratic votes that the party had hoped for (or, that Republicans had feared), with no overall benefit to their numbers added.
Voter Breakdowns: Show Us What You’re Made of, Philly
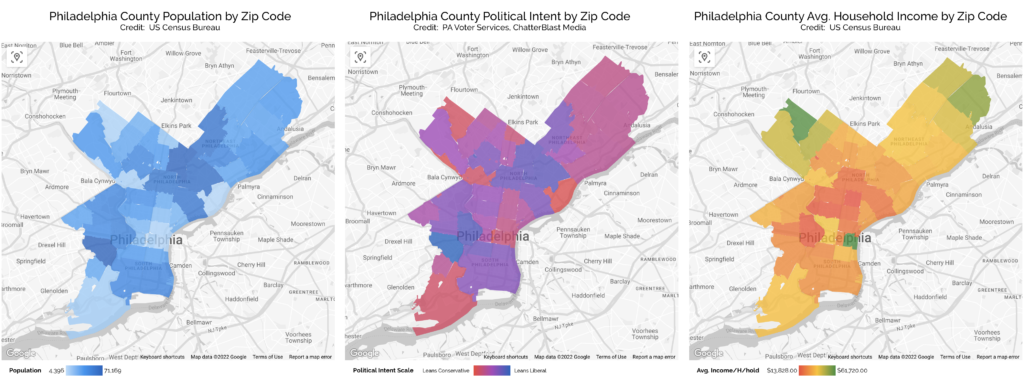
Demographics play a key role in understanding how specific areas will lean in an election. Breaking down Philly voters, we found the highest concentration of Democrats reside in Kingsessing and Belmont, while West Torresdale and Fox Chase hold the highest concentration of conservatives. Through this, we see that liberals tend to live in lower-income neighborhoods, while conservatives tend to be in higher-income areas.
With Philadelphia ranking third in US cities for highest poverty levels (over a quarter of Philadelphia’s population lives in poverty, double the national average), and the city’s median income only $49,000 (three-quarters of the national average), it’s easy to see why Philadelphia continuously leans liberal. As Democratic values often include securing welfare and educational services, it makes sense that Philly’s impoverished communities would back a leftist candidate.
Of course, income levels aren’t the only thing that matters when it comes to voter demographics.
Philadelphia has always been known for its racial diversity, which continues to grow still. Since 2016, there has been an increase of diversity within the city, with 41% of the population identifying as Black, 35% as White, 15% as Hispanic, and around 7% as Asian. As White voters have consistently leaned more Republican in the past, the fact that their voter makeup only represents slightly over one third of the city’s makeup is once again reflected in Philly’s overall left-leaning majority.
The Social Media Impact: Campaign Games
Over the past four elections, more than 200,000 people that were registered to vote, didn’t. It’s no secret that social media plays a huge role in politics, as the campaigns and advertisements we interact with leave a heavy influence on our decision. Thus, the power of digital advertising should be used in a candidates favor in order to get viewer support and pull in more of those non-voters.
Through digital campaigns, candidates can create awareness that directly states their message, plan of action, or goal in order to get viewer’s support. Or, conversely, social media can be used against a candidate… as we’ve seen with all of Fetterman’s memes against Oz this midterm!
When measuring a digital campaign’s reach, there are several different strategy types to look at:
- Awareness campaigns are “aimed at making people aware of: the importance of their participation in electoral processes either as voters or candidates; different modes of participation; the procedure to become eligible for voting and to actually cast their vote; and ways to assess the poll-worthiness of a candidate.” Put very simply, they create awareness of an issue, the candidate, and the voting process to equip voters with necessary information.
- Connected TV, or CTV ads allow for “deep audience targeting and the ability to directly measure impact,” which is why these types of ads are ideal for candidates. With over 84 million American homes relying on CTV devices (phones, computers, televisions), user demand is only continuing to grow. These types of ads provide powerful, real-time insights that can be easily personalized for customer engagement. As streaming services are now ramping up for the upcoming election, these ads are expected to fill American households.
- Then there’s grassroot campaigns, which create content aimed towards a very specific, niche audience. For example, North Philadelphia would be a great target audience for a grassroot campaign aimed at food deserts, as that issue directly impacts the community there. The main goal for this type of campaign is high page views from the targeted audience, a clear cut message that gets across, and ultimately gaining the targeted audience’s votes in the upcoming election. Grassroot campaigns are a powerful tool to use in combating low-voter turnout.
So… what have we learned today? Looking closely at the population of Philadelphia, we can see it’s leaned liberal for a while, and likely will again in November’s midterm election. However, in the past, social media has skewed voter turnout and proven voting to be a numbers game. Thus, it’s critical to look at the whole picture (voter stats and past campaigns included) to understand the impact social media has on the election process and why candidates should be proactive in using it ethically to raise support for their future campaigns.
If you’re looking for an organization to help with ethical data collection and running smart, efficient campaigns for results, contact us!