Without knowing how people are consuming content, how can a business possibly advertise effectively? Well, thanks to the Nielsen Total Audience Report, the most recent iteration of which came out on December 12, businesses can now know a lot more about audience behaviors. If you’re not an advertiser, get ready for some in-depth information about how our country consumes media.
Don’t worry, the TV isn’t talking to you. This data was collected ethically!
Adults spend 10 hours and 24 minutes per day connected to media.
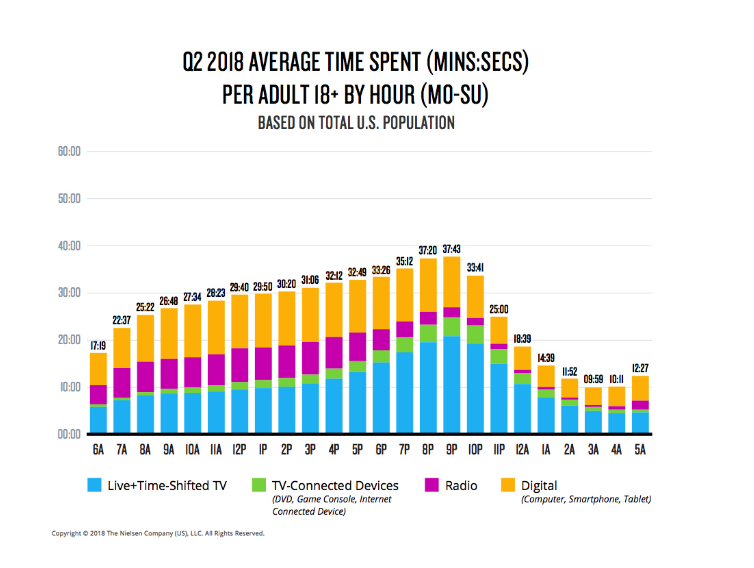
If this shows anything notable, it’s that TV and radio are far from dead, accounting for 5 hours and 34 minutes of the average adult’s day. Of that day, another 3 hours and 34 minutes are spent on a computer (32 minutes), a tablet (43 minutes) or a smartphone (2 hours, 19 minutes). Time shifted TV accounts for 32 minutes, and other internet connected devices accounted for 26 minutes.
To break that down further, adults 50-64 spend more time on media than any other age group. They spend 2 hours and 34 minutes online, and 30 minutes on TV connected devices. On the other end of the spectrum, adults 18-34 spend more time on digital than on TV. 44% of their day is on the web and 14% is spent on a TV connected device.
If you’re wondering why TV connected devices are important, buckle up: Over-The-Top (OTT) video content (Netflix, Hulu, HBOGo, etc.) reaches 170.1 million people in the US, compared to 119.9 million traditional television households in the US. People using connected TV’s with services such as Apple TV and Roku consume 42 hours of content a month, making this space an extremely valuable and competitive place to serve advertising. Instead of sending out broad messages to broad audiences across large metropolitan areas, marketers can now hone in on geographic and demographic audiences that relate to their products, which makes their efforts a lot more effective, and gives the consumer a better advertising experience. That’s good news for everyone!
On that note, you ever watch a show and hop on your phone to check something out?
Of the people watching TV, 45% say that they always or very often use a digital device at the same time. 28% responded ‘sometimes’, which brings the total potential audience to 73% of TV viewers. 71% of these people look up the info related to the content, 35% look up or shop the products or services, and 28% write or read posts related to the content.
It’s pretty wild to think that 20 years ago we actually had to sprint out to Service Merchandise to snag a portable TV if we wanted to catch the latest Dawson’s Creek episode and hang out with our friends at the same time.
Simpler times, Dawson. Simpler times.
Speaking of social media, Adults spend 44 minutes a day on social networks – 4 minutes on a computer, 6 minutes on a tablet, and the rest – 34 minutes – on a smartphone. This is a good reminder to make sure your business’s website is mobile friendly, otherwise you’re missing massive opportunities.
As far as timing goes, 9pm is the peak hour for all media. For digital, 9am to 9pm is the absolute safe zone – meaning there’s less than a minute of dip in activity across those hours. Throughout the day, 11pm is the dead zone for digital – but even then, 23% of the time, someone’s online.
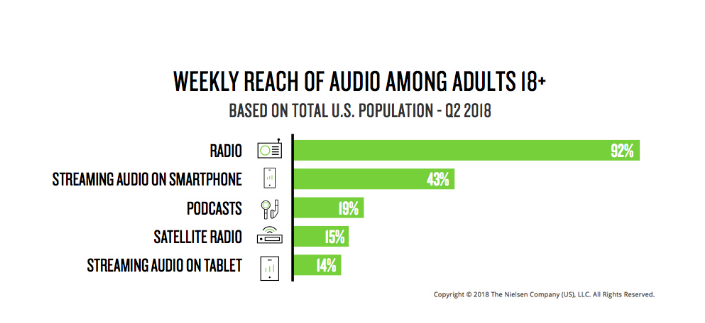
Remember when I said radio isn’t dead? Radio reaches 92% of the US population, which may be shocking to some people. 24% of homes now own a smart speaker, and 90% of those homes use it mainly to stream audio. 43% of the total US population streams audio on their smartphone, 19% stream podcasts, and 14% stream audio through their tablet.
We are in some very, very interesting times, friends. By 2020, each person is expected to own 6.58 internet connected devices – that’s 6.58 ways to consume media, and 6.58 places for smart businesses to reach you with targeted, relevant messages. Thankfully, ChatterBlast is at the forefront of content strategy, distribution, marketing technology, advertising and analytics. If your business could benefit from a strategic approach to branding, content and advertising, reach out! We would love to make these metrics work for you.
Looking for the whole report? Trying to figure out how they collected the data? Download all of it here.

